
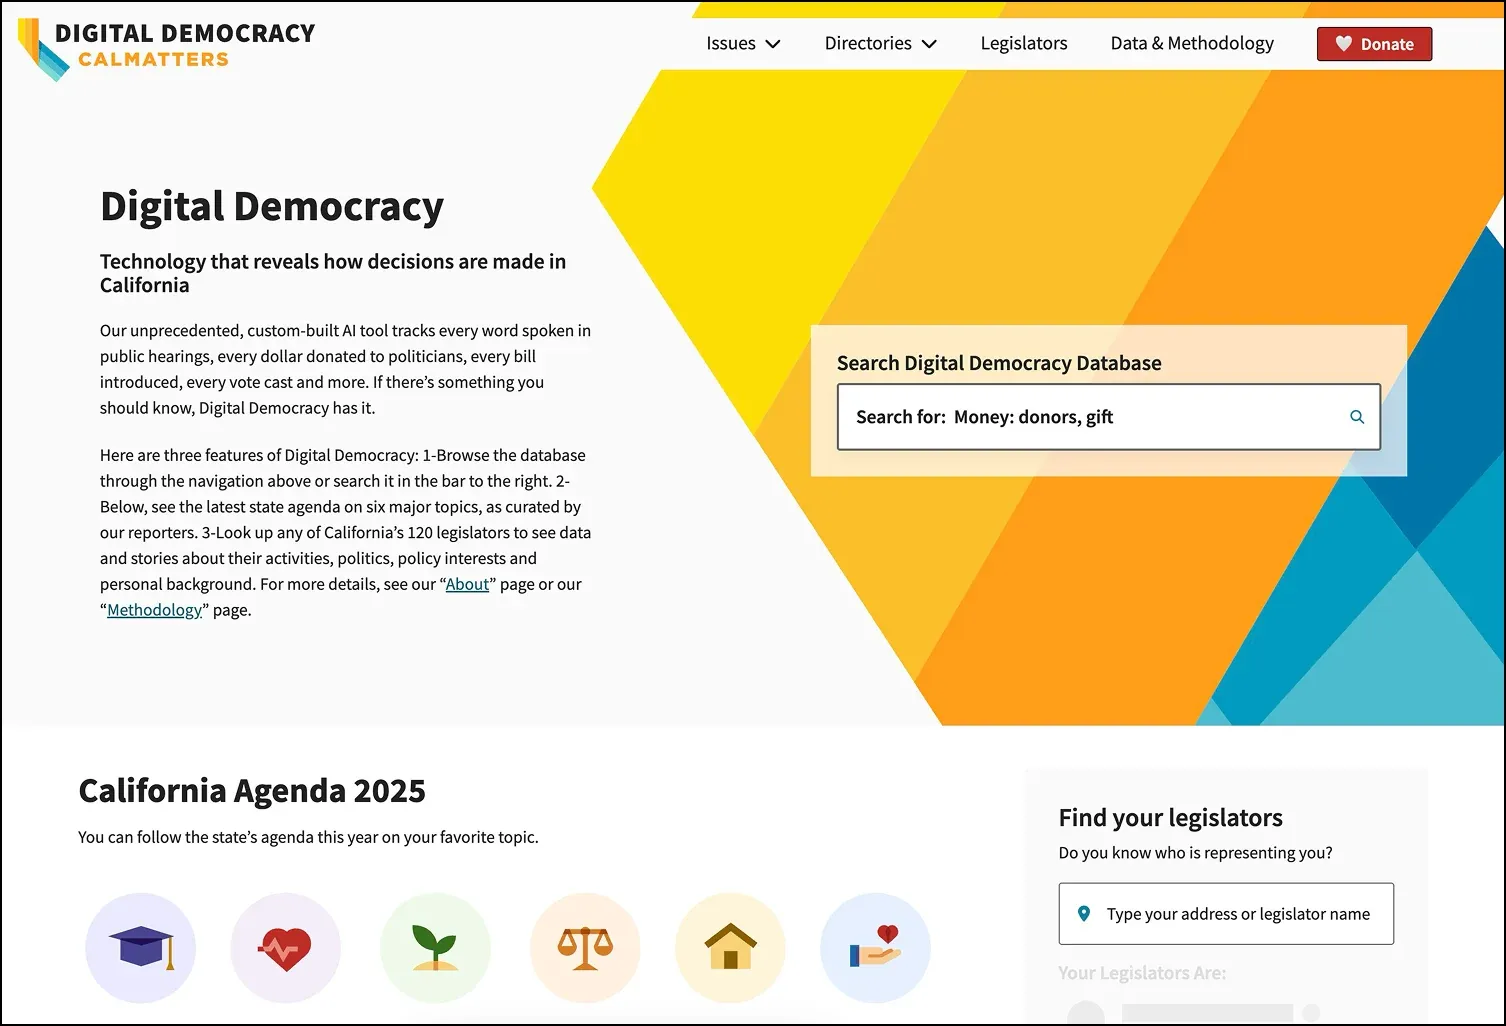
Digital Democracy
A mountain of California political data, distilled into screens people can navigate.
- Information architecture
- Data visualisation
- Competitive analysis
- Wireframes
- 6interwoven categories decoded from a massive database into the IA
- 3competitor platforms put through competitive and heuristic evaluation
- 60%of total effort slated for design, so wireframes stayed lower fidelity
01 · The brief
Track a state, simply.
CalMatters, a nonprofit covering California politics, wanted a user-friendly platform to track the state’s vast, ever-changing political data. As UX lead I distilled it into manageable pieces.
The data covered people (politicians and the public), committees, hearings, bills, organisations and financial details. I designed screens for all of those data points. This was ultimately a data visualisation project.
Business goals
- Promote accountability in state politics
- Empower journalists with data access
- Increase public engagement with governance
User needs
- Access real-time political updates
- Understand data without expertise
- Find relevant info quickly
02 · Strategy
Divide and conquer.
There was a mountain of work, especially the data, and only a handful of weeks. I front-loaded my hours on discovery, research and IA so the design work could move quickly.
Discovery meant workshops for insights, stakeholder interviews and defining the project scope early.
03 · Research
Three competitors, closely read.
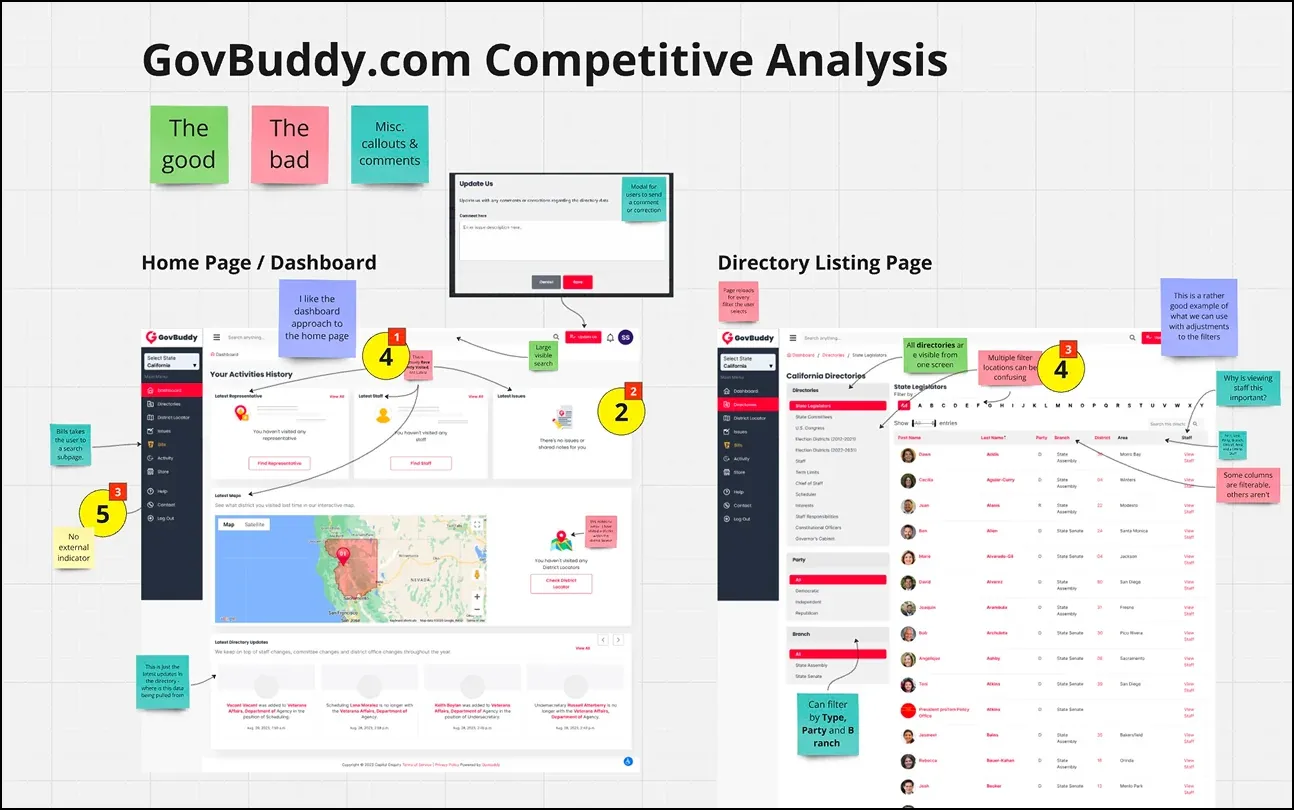
Desk research was the main method because of time limits. I ran competitive and heuristic evaluations on three competitor platforms.
The findings drove the design decisions that followed: benchmarking rival data layouts, identifying usability strengths and flaws, and shaping the IA. Research also covered the site’s data trends.
04 · Information architecture
Six categories, one web.
I decoded the massive database into an IA of six interwoven categories, with the data linked so navigation stays seamless.
05 · Wireframes
Wireframes, reviewed as they landed.
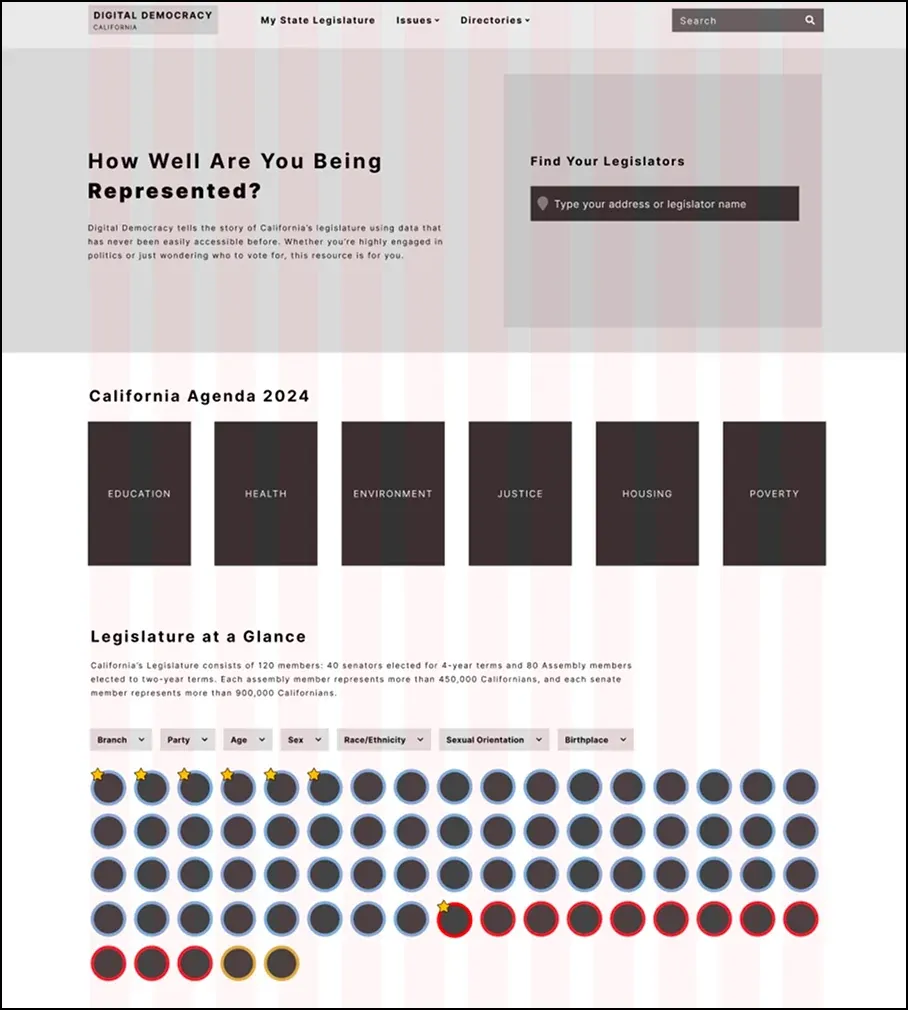
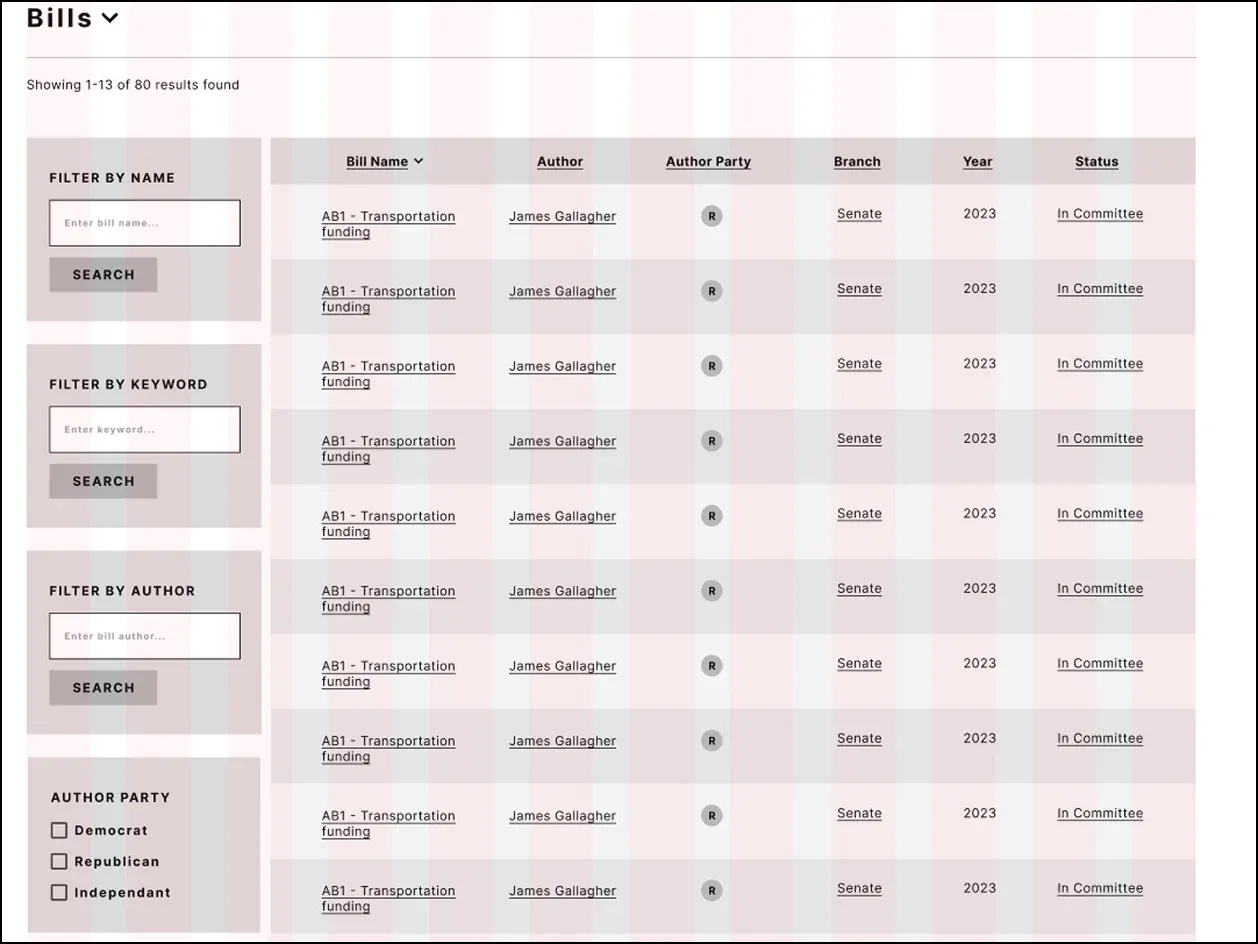
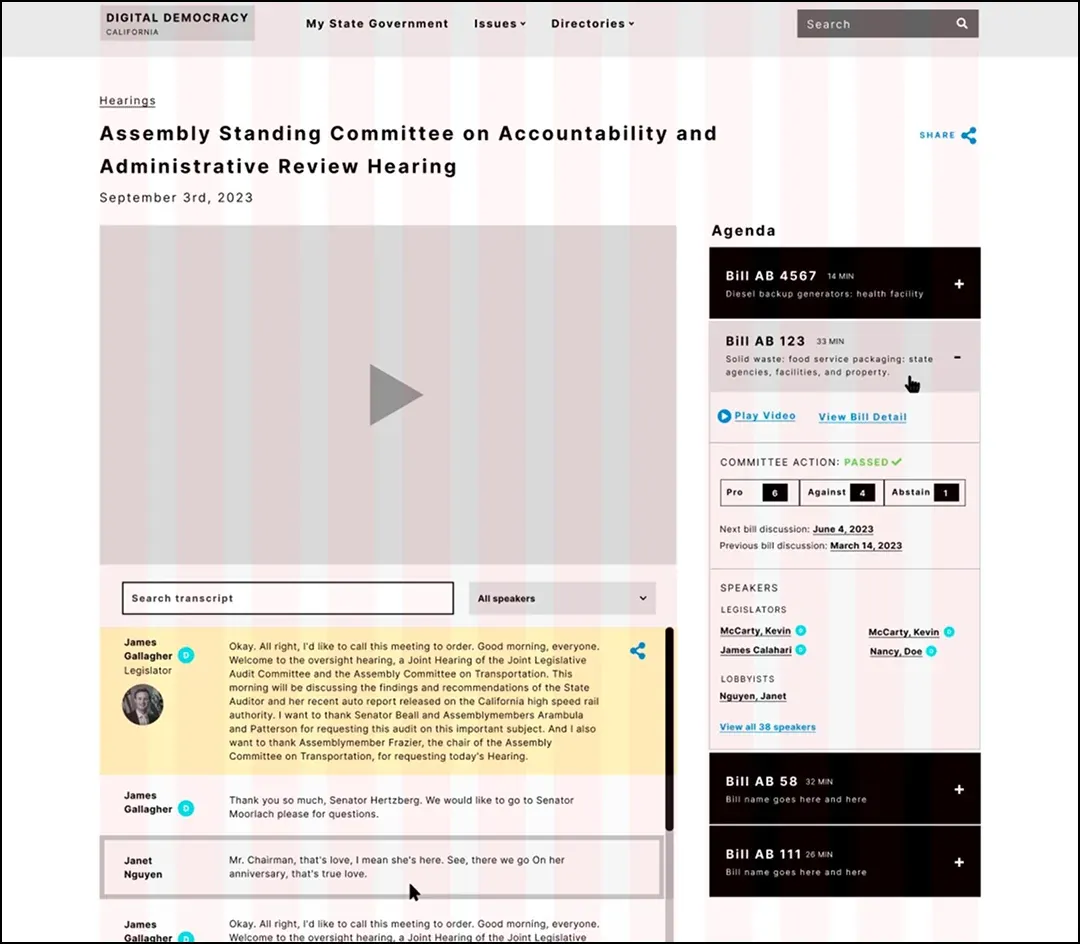
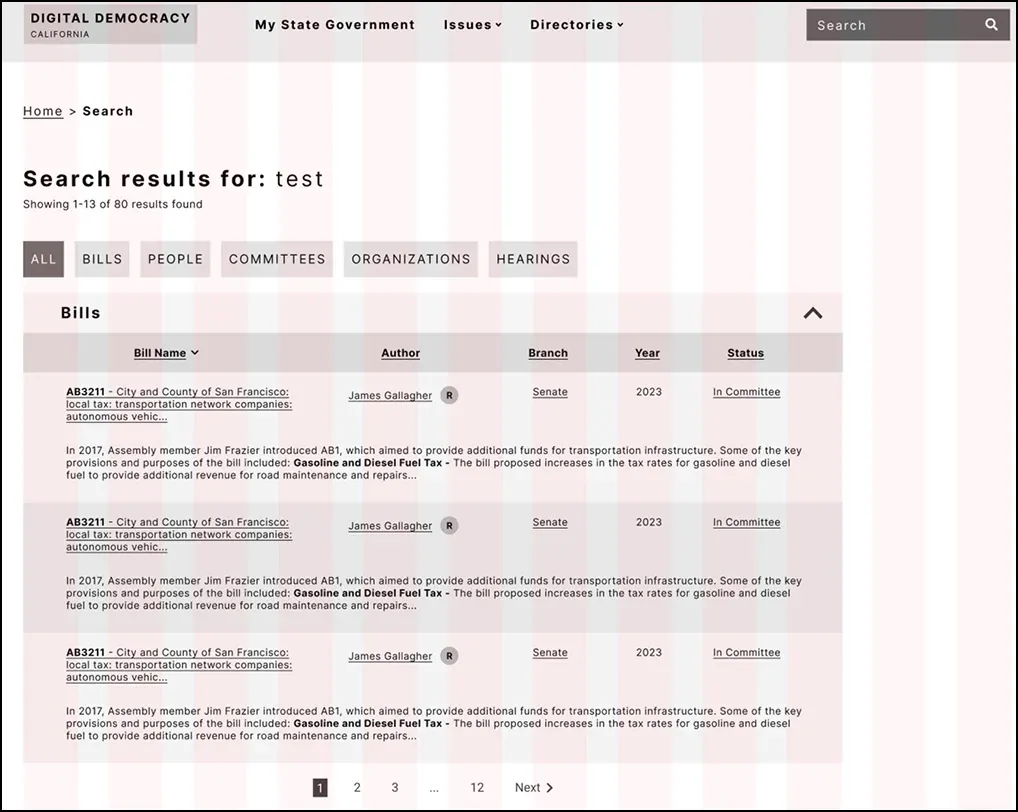
Design was slated as 60% of total effort, so I kept to lower fidelity wireframes and reviewed each screen as it landed.
I created versions of each screen based on the insights from discovery, research and IA. When a screen was done it went straight to the stakeholder team for feedback, which kept the work efficient and moving with no down-time.
06 · The result
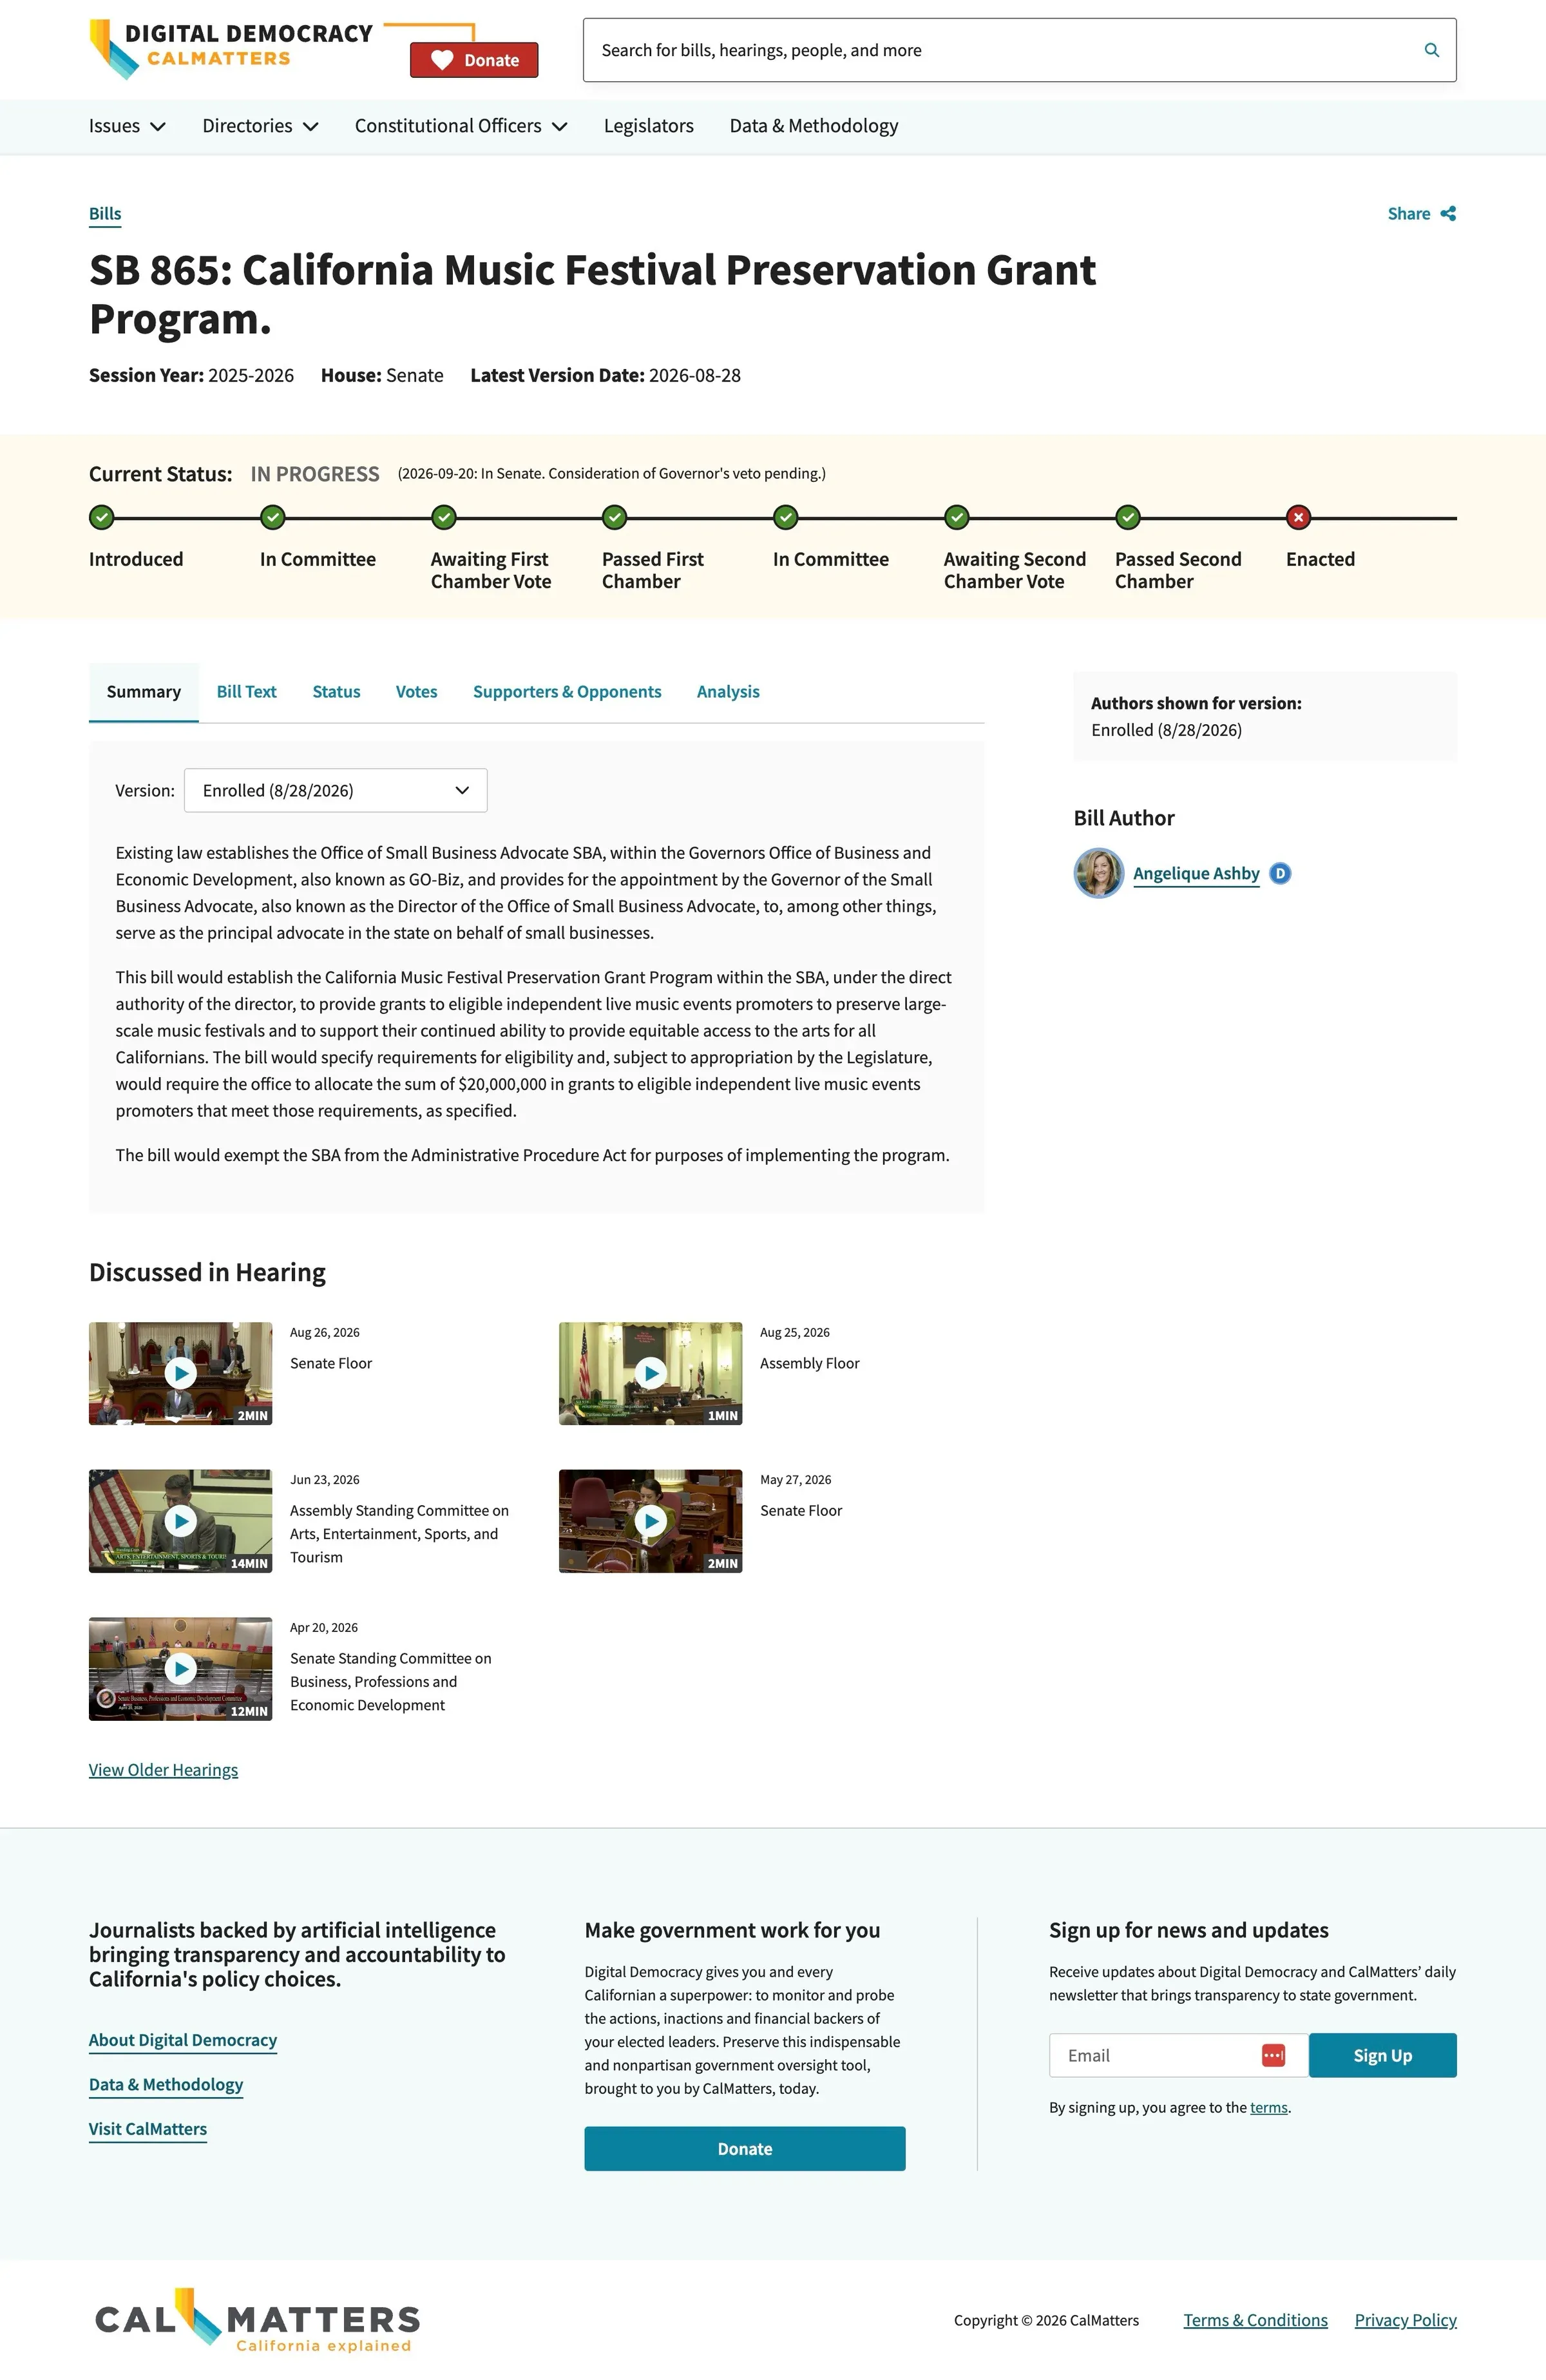
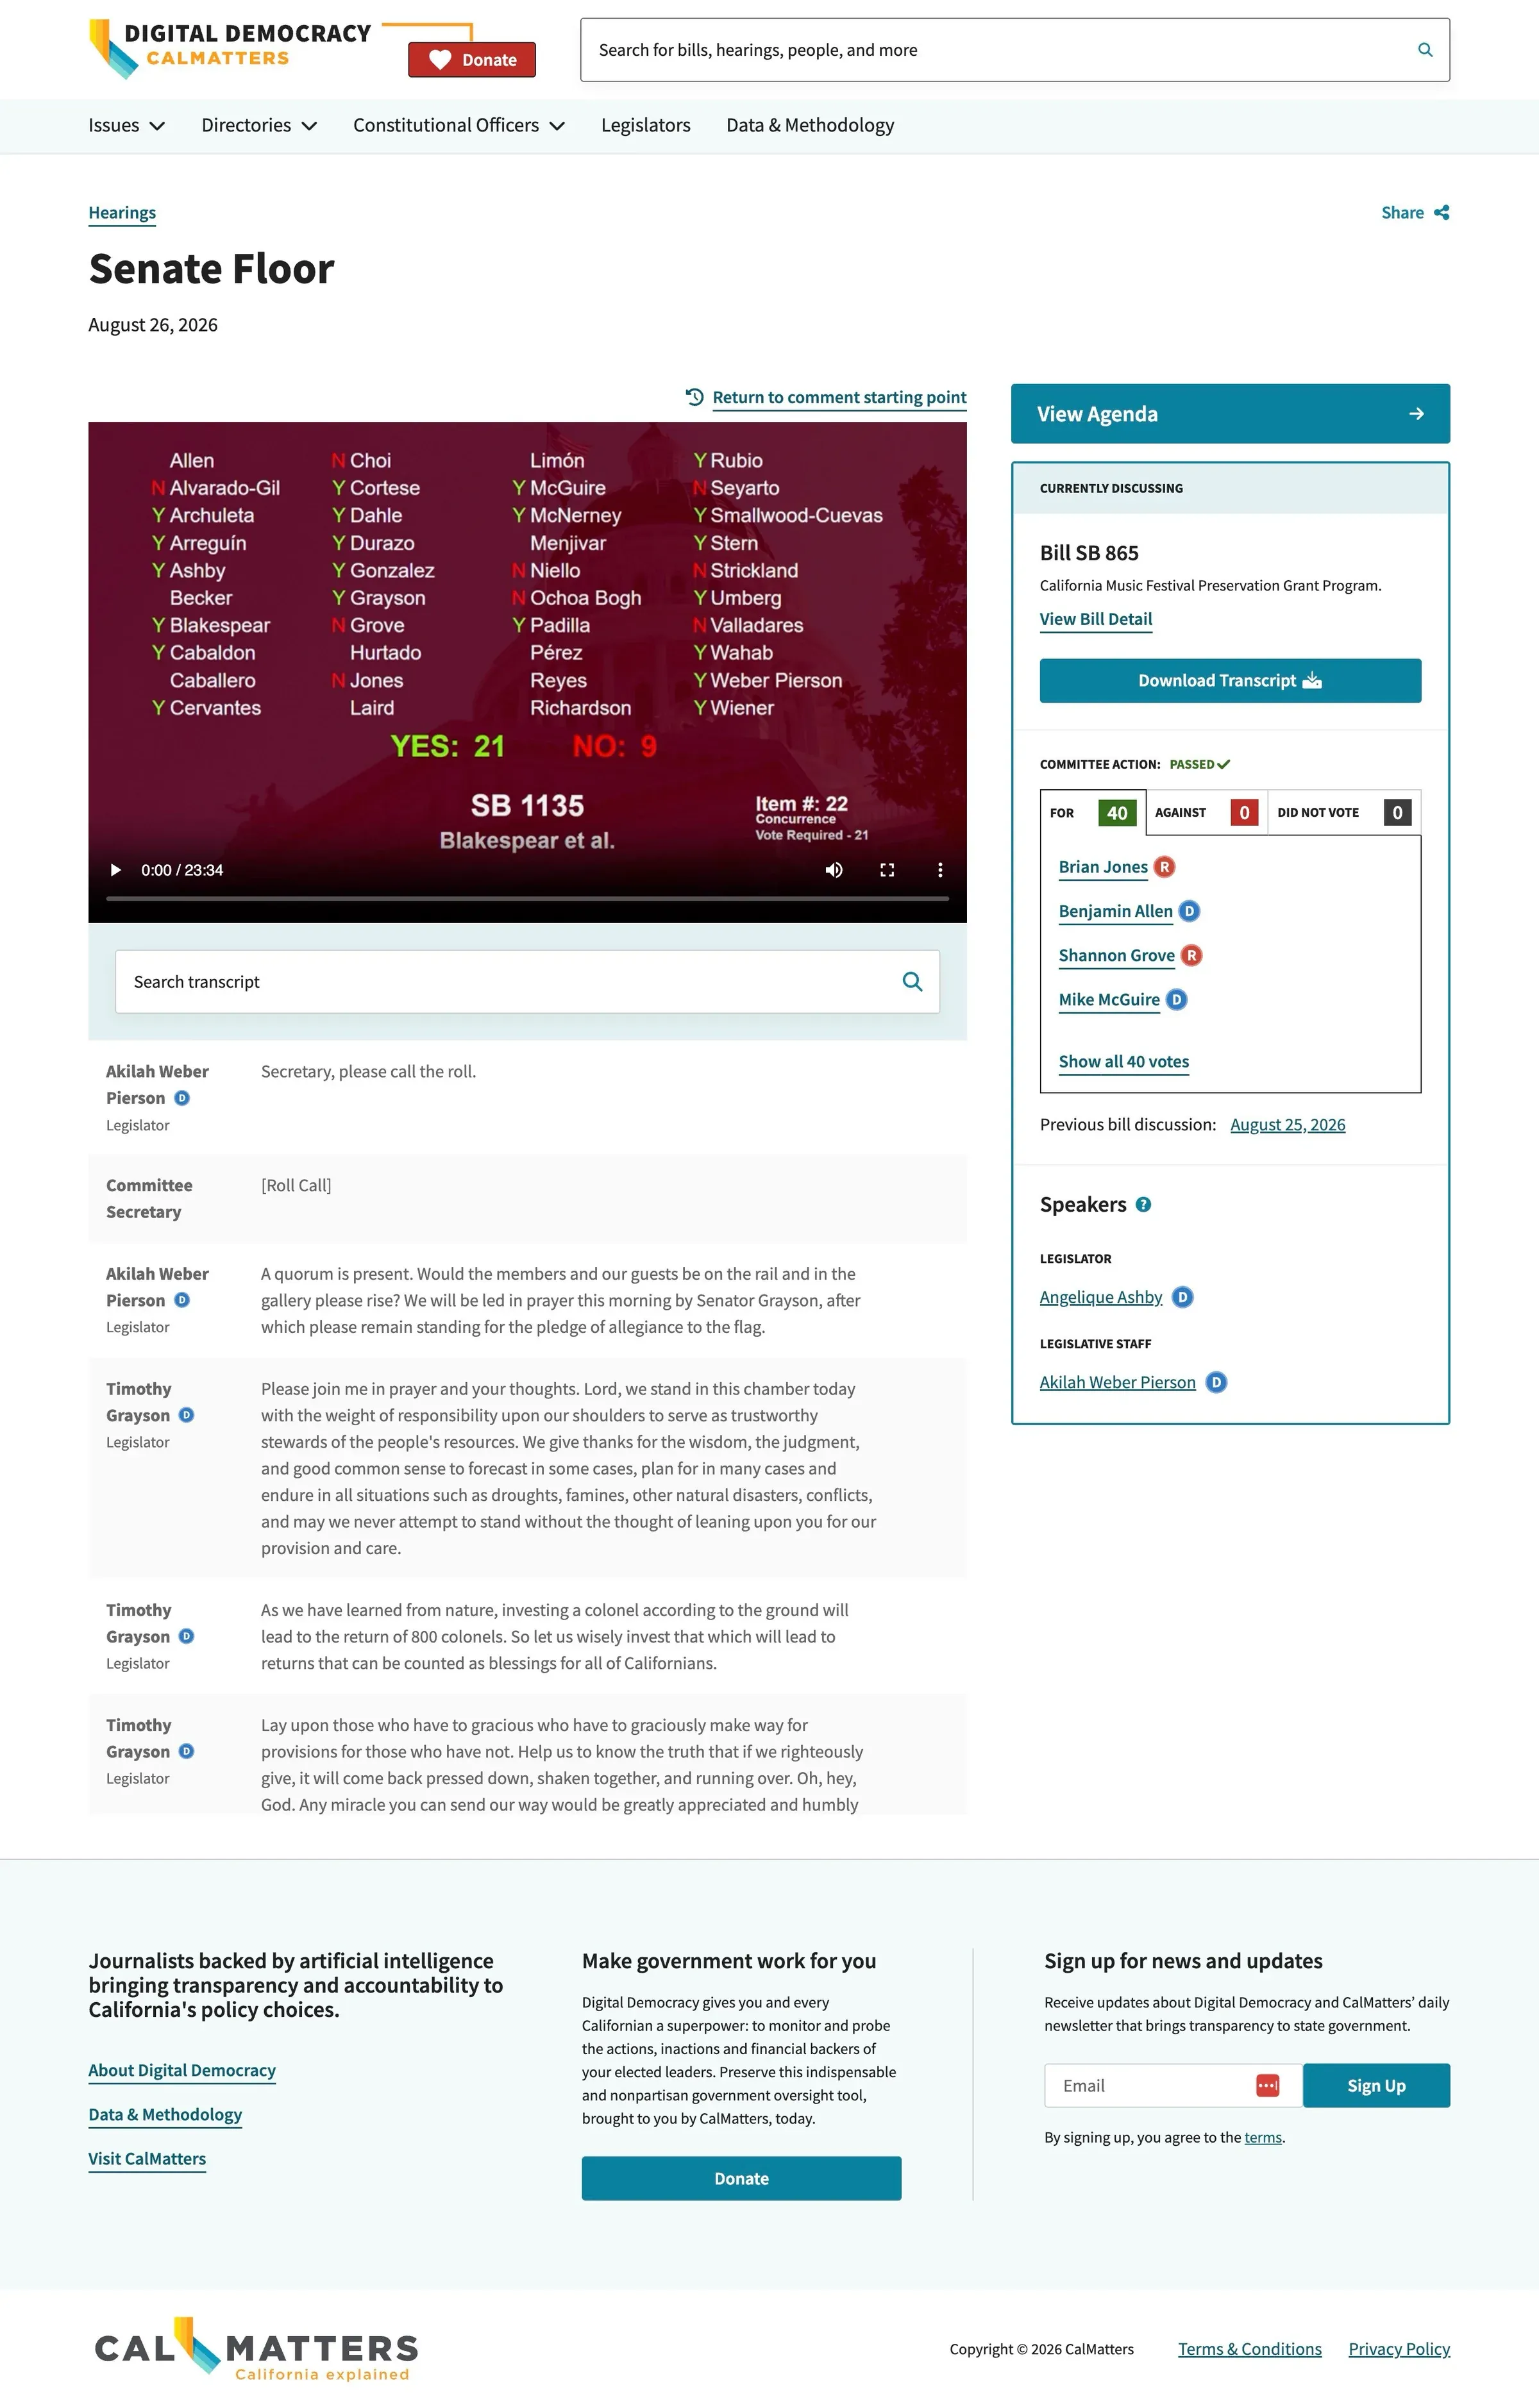
The final screens.
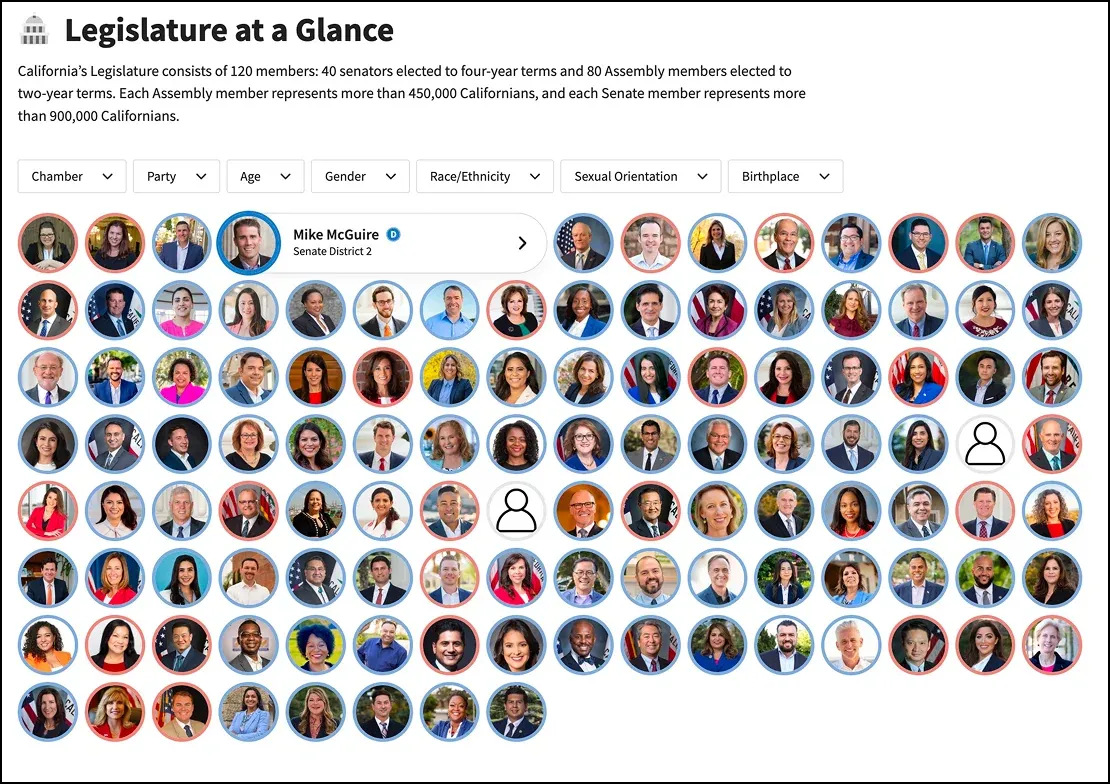
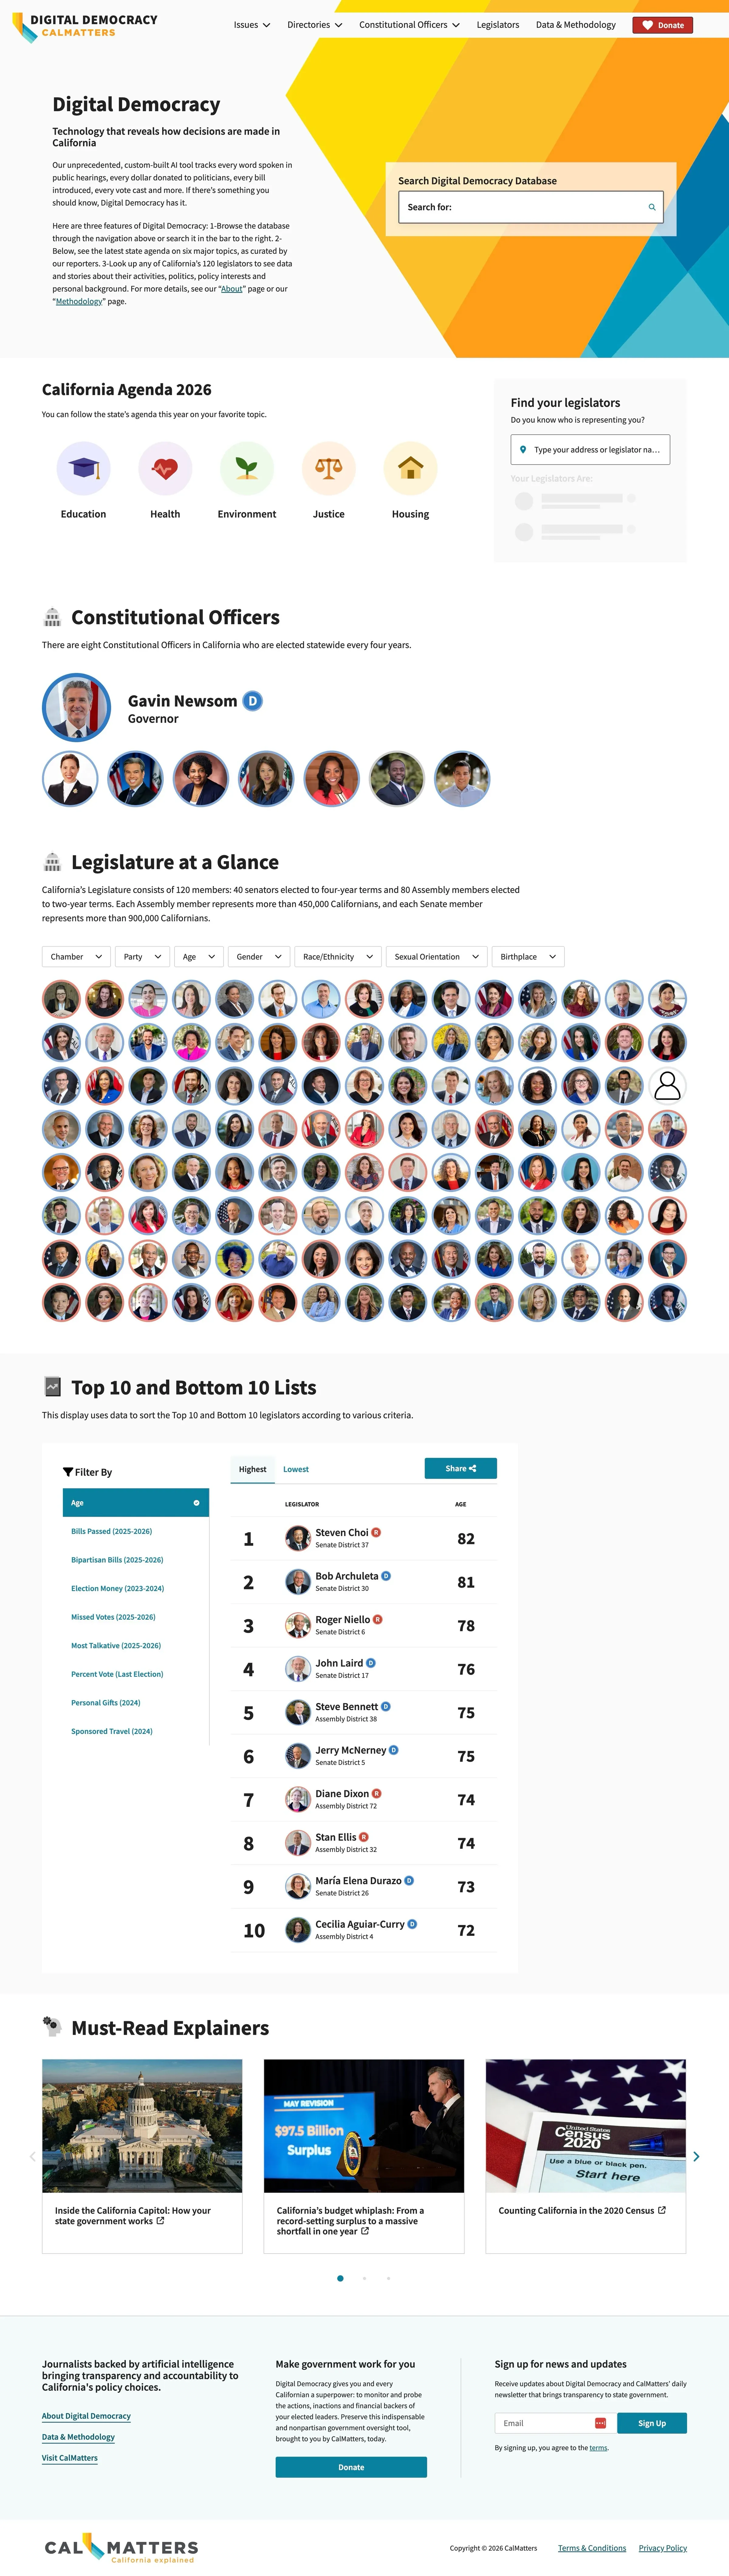
After the design and redesigns, every wireframe was presented, and the UX came to life in the final screens.
The end result is, in my opinion, a masterpiece in data visualisation.
07 · Final thoughts
A wonderful project to lead.
I am proud of this work. Making sense of this much data was something I never thought I was capable of, and with a rockstar team I am very happy with the outcome.
08 · Live site